Public companies in JD Health International Inc. (HKG:6618) are its biggest bettors, and their bets paid off as stock gained 3.7% last week
Key Insights
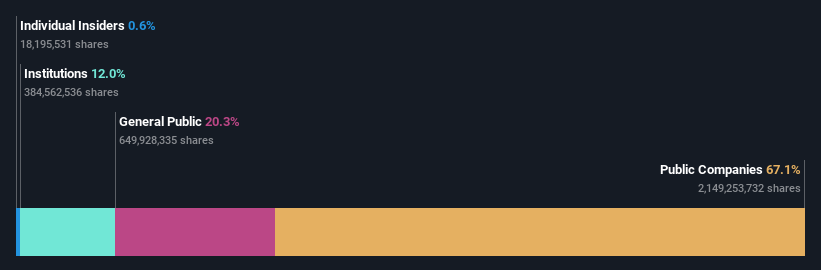
- Significant control over JD Health International by public companies implies that the general public has more power to influence management and governance-related decisions
- The largest shareholder of the company is JD.com, Inc. with a 67% stake
- Recent sales by insiders
To get a sense of who is truly in control of JD Health International Inc. (HKG:6618), it is important to understand the ownership structure of the business. The group holding the most number of shares in the company, around 67% to be precise, is public companies. That is, the group stands to benefit the most if the stock rises (or lose the most if there is a downturn).
Clearly, public companies benefitted the most after the company's market cap rose by HK$4.2b last week.
Let's take a closer look to see what the different types of shareholders can tell us about JD Health International.
Check out our latest analysis for JD Health International
What Does The Institutional Ownership Tell Us About JD Health International?
Many institutions measure their performance against an index that approximates the local market. So they usually pay more attention to companies that are included in major indices.
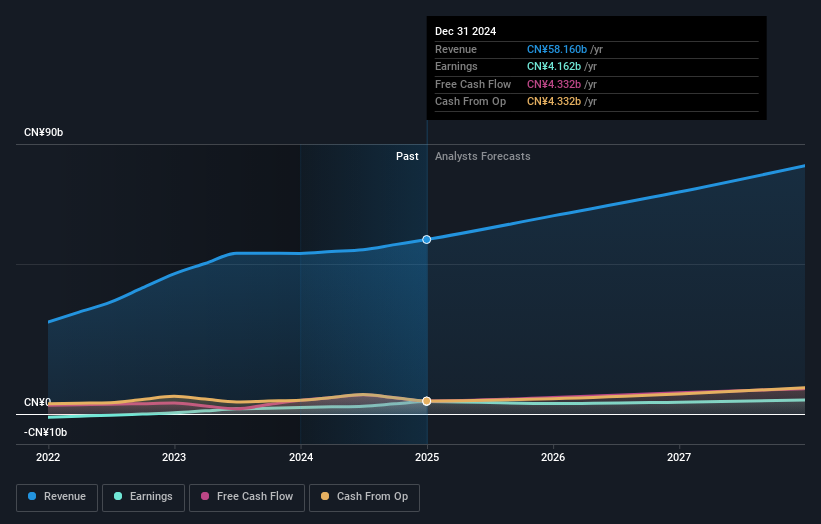
We can see that JD Health International does have institutional investors; and they hold a good portion of the company's stock. This suggests some credibility amongst professional investors. But we can't rely on that fact alone since institutions make bad investments sometimes, just like everyone does. When multiple institutions own a stock, there's always a risk that they are in a 'crowded trade'. When such a trade goes wrong, multiple parties may compete to sell stock fast. This risk is higher in a company without a history of growth. You can see JD Health International's historic earnings and revenue below, but keep in mind there's always more to the story.
We note that hedge funds don't have a meaningful investment in JD Health International. Looking at our data, we can see that the largest shareholder is JD.com, Inc. with 67% of shares outstanding. With such a huge stake in the ownership, we infer that they have significant control of the future of the company. Krane Funds Advisors, LLC is the second largest shareholder owning 1.8% of common stock, and The Vanguard Group, Inc. holds about 1.3% of the company stock.
While studying institutional ownership for a company can add value to your research, it is also a good practice to research analyst recommendations to get a deeper understand of a stock's expected performance. Quite a few analysts cover the stock, so you could look into forecast growth quite easily.
Insider Ownership Of JD Health International
While the precise definition of an insider can be subjective, almost everyone considers board members to be insiders. Management ultimately answers to the board. However, it is not uncommon for managers to be executive board members, especially if they are a founder or the CEO.
I generally consider insider ownership to be a good thing. However, on some occasions it makes it more difficult for other shareholders to hold the board accountable for decisions.
Our most recent data indicates that insiders own less than 1% of JD Health International Inc.. Being so large, we would not expect insiders to own a large proportion of the stock. Collectively, they own HK$657m of stock. In this sort of situation, it can be more interesting to see if those insiders have been buying or selling.
General Public Ownership
With a 20% ownership, the general public, mostly comprising of individual investors, have some degree of sway over JD Health International. While this size of ownership may not be enough to sway a policy decision in their favour, they can still make a collective impact on company policies.
Public Company Ownership
Public companies currently own 67% of JD Health International stock. This may be a strategic interest and the two companies may have related business interests. It could be that they have de-merged. This holding is probably worth investigating further.
Next Steps:
It's always worth thinking about the different groups who own shares in a company. But to understand JD Health International better, we need to consider many other factors.
I always like to check for a history of revenue growth. You can too, by accessing this free chart of historic revenue and earnings in this detailed graph.
If you are like me, you may want to think about whether this company will grow or shrink. Luckily, you can check this free report showing analyst forecasts for its future.
NB: Figures in this article are calculated using data from the last twelve months, which refer to the 12-month period ending on the last date of the month the financial statement is dated. This may not be consistent with full year annual report figures.
Have feedback on this article? Concerned about the content? Get in touch with us directly. Alternatively, email editorial-team (at) simplywallst.com.
This article by Simply Wall St is general in nature. We provide commentary based on historical data and analyst forecasts only using an unbiased methodology and our articles are not intended to be financial advice. It does not constitute a recommendation to buy or sell any stock, and does not take account of your objectives, or your financial situation. We aim to bring you long-term focused analysis driven by fundamental data. Note that our analysis may not factor in the latest price-sensitive company announcements or qualitative material. Simply Wall St has no position in any stocks mentioned.
① During the campaign period, US stocks, US stocks short selling, US stock options, Hong Kong stocks, and A-shares trading will maintain at $0 commission, and no subscription/redemption fees for mutual fund transactions. $0 fee offer has a time limit, until further notice. For more information, please visit: https://www.webull.hk/pricing
Webull Securities Limited is licensed with the Securities and Futures Commission of Hong Kong (CE No. BNG700) for carrying out Type 1 License for Dealing in Securities, Type 2 License for Dealing in Futures Contracts and Type 4 License for Advising on Securities.

English