Asian Penny Stocks: China Oriental Group Leads 2 Other Picks To Consider
As global markets show signs of easing trade tensions, the Asian financial landscape remains a focal point for investors seeking opportunities in emerging sectors. Penny stocks, often associated with smaller or newer companies, continue to present intriguing possibilities for growth despite their somewhat outdated label. With strong financials and solid fundamentals, these stocks can offer potential upside at lower price points; this article highlights three such promising candidates in Asia's vibrant market.
Top 10 Penny Stocks In Asia
| Name | Share Price | Market Cap | Rewards & Risks |
| Advice IT Infinite (SET:ADVICE) | THB4.76 | THB2.95B | ✅ 4 ⚠️ 3 View Analysis > |
| Chumporn Palm Oil Industry (SET:CPI) | THB2.56 | THB1.62B | ✅ 2 ⚠️ 2 View Analysis > |
| CNMC Goldmine Holdings (Catalist:5TP) | SGD0.42 | SGD170.22M | ✅ 4 ⚠️ 3 View Analysis > |
| YKGI (Catalist:YK9) | SGD0.104 | SGD44.2M | ✅ 2 ⚠️ 3 View Analysis > |
| Beng Kuang Marine (SGX:BEZ) | SGD0.197 | SGD39.25M | ✅ 4 ⚠️ 3 View Analysis > |
| Yangzijiang Shipbuilding (Holdings) (SGX:BS6) | SGD2.25 | SGD8.86B | ✅ 5 ⚠️ 0 View Analysis > |
| Bosideng International Holdings (SEHK:3998) | HK$4.11 | HK$47.05B | ✅ 4 ⚠️ 1 View Analysis > |
| Lever Style (SEHK:1346) | HK$1.06 | HK$668.81M | ✅ 4 ⚠️ 2 View Analysis > |
| Goodbaby International Holdings (SEHK:1086) | HK$1.12 | HK$1.87B | ✅ 4 ⚠️ 2 View Analysis > |
| TK Group (Holdings) (SEHK:2283) | HK$1.92 | HK$1.6B | ✅ 4 ⚠️ 1 View Analysis > |
Click here to see the full list of 1,163 stocks from our Asian Penny Stocks screener.
We're going to check out a few of the best picks from our screener tool.
China Oriental Group (SEHK:581)
Simply Wall St Financial Health Rating: ★★★★☆☆
Overview: China Oriental Group Company Limited manufactures and sells iron and steel products for downstream steel manufacturers in the People’s Republic of China, with a market cap of approximately HK$4.43 billion.
Operations: The company generates revenue primarily from its Iron and Steel segment, which accounts for CN¥42.86 billion, with an additional contribution of CN¥96.83 million from Real Estate activities.
Market Cap: HK$4.43B
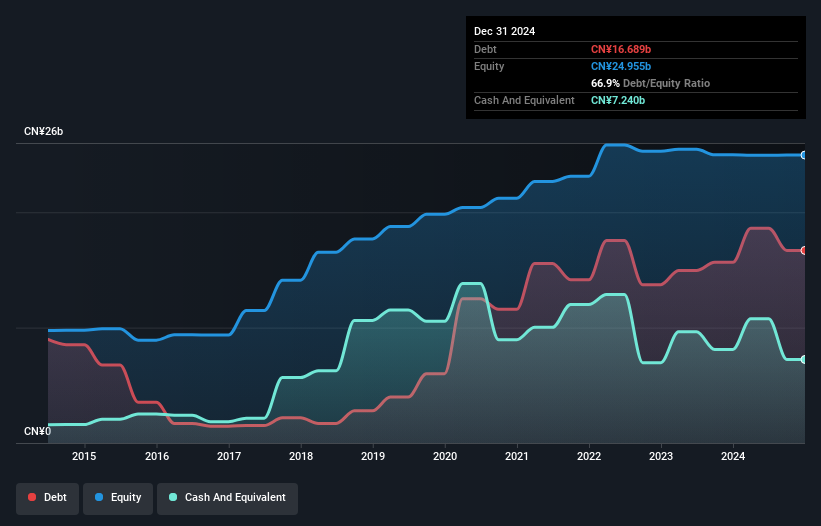
China Oriental Group has shown a significant turnaround, reporting net income of CN¥149.11 million for 2024 compared to a loss the previous year. Despite earnings volatility and a low return on equity of 0.9%, the company remains financially stable with short-term assets exceeding liabilities and satisfactory debt levels. The board and management are experienced, contributing to its strategic direction amidst industry challenges. Recent announcements include special and ordinary dividends, signaling confidence in future cash flows despite past declines in revenue from CN¥46.26 billion to CN¥42.96 billion year-on-year, highlighting resilience in its core iron and steel segment amidst market fluctuations.
- Navigate through the intricacies of China Oriental Group with our comprehensive balance sheet health report here.
- Assess China Oriental Group's previous results with our detailed historical performance reports.
Viva Goods (SEHK:933)
Simply Wall St Financial Health Rating: ★★★★★☆
Overview: Viva Goods Company Limited is an investment holding company that supplies apparel and footwear across various regions including the UK, Ireland, the US, China, Asia, Europe, the Middle East, and Africa with a market cap of approximately HK$3.69 billion.
Operations: The company's revenue is primarily derived from its Multi-Brand Apparel and Footwear segment, which accounts for HK$9.87 billion, followed by the Sports Experience segment at HK$559.30 million.
Market Cap: HK$3.69B
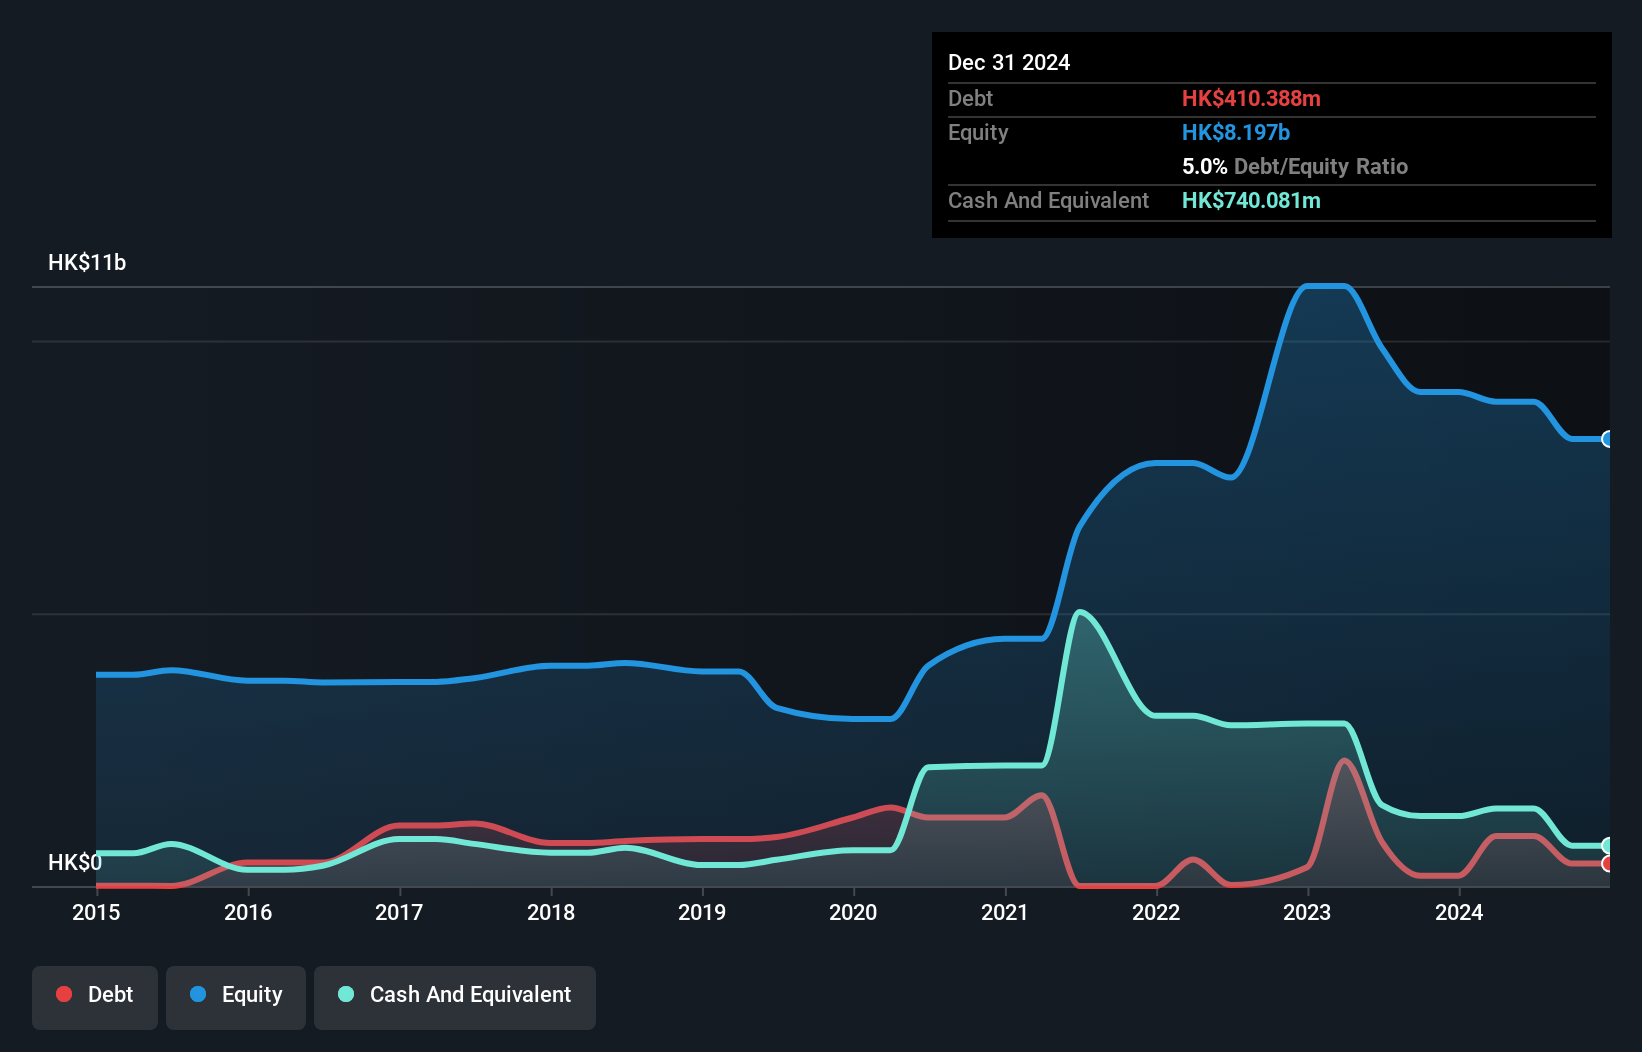
Viva Goods Company Limited, despite being unprofitable, has shown improvements with a reduced net loss of HK$70.41 million for 2024 compared to the previous year. The company's short-term assets comfortably cover both short-term and long-term liabilities, reflecting financial stability. Its management and board are highly experienced with average tenures of 8 and 9.8 years respectively, supporting strategic continuity. Although earnings have declined over recent years, better cost control in its multi-brand apparel segment has helped mitigate losses. However, no dividend was declared for 2024 as opposed to the previous year's payout, indicating cautious cash management amidst ongoing challenges.
- Click here and access our complete financial health analysis report to understand the dynamics of Viva Goods.
- Gain insights into Viva Goods' past trends and performance with our report on the company's historical track record.
Hubei Guochuang Hi-tech MaterialLtd (SZSE:002377)
Simply Wall St Financial Health Rating: ★★★★☆☆
Overview: Hubei Guochuang Hi-tech Material Co., Ltd operates in the real estate service sector and specializes in the research, development, production, and sale of modified asphalt in China with a market capitalization of approximately CN¥2.54 billion.
Operations: Hubei Guochuang Hi-tech Material Co., Ltd has not reported specific revenue segments, focusing its operations primarily on the research, development, production, and sale of modified asphalt within China.
Market Cap: CN¥2.54B
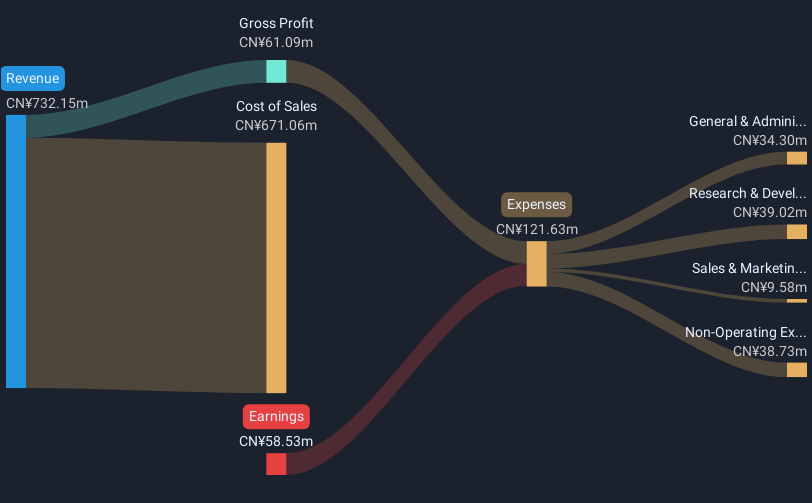
Hubei Guochuang Hi-tech Material Co., Ltd, operating in the real estate service sector, has shown financial resilience despite past unprofitability. The company reported a significant turnaround in Q1 2025 with a net income of CN¥2.19 million compared to a net loss the previous year, driven by increased sales from CN¥80.82 million to CN¥104.68 million. Short-term assets exceed liabilities, indicating solid liquidity management, while its board's average tenure of 5.8 years suggests experienced oversight. However, high debt levels remain a concern with a net debt to equity ratio of 58.4%, requiring careful monitoring moving forward.
- Click here to discover the nuances of Hubei Guochuang Hi-tech MaterialLtd with our detailed analytical financial health report.
- Evaluate Hubei Guochuang Hi-tech MaterialLtd's historical performance by accessing our past performance report.
Next Steps
- Reveal the 1,163 hidden gems among our Asian Penny Stocks screener with a single click here.
- Ready To Venture Into Other Investment Styles? Explore 21 top quantum computing companies leading the revolution in next-gen technology and shaping the future with breakthroughs in quantum algorithms, superconducting qubits, and cutting-edge research.
This article by Simply Wall St is general in nature. We provide commentary based on historical data and analyst forecasts only using an unbiased methodology and our articles are not intended to be financial advice. It does not constitute a recommendation to buy or sell any stock, and does not take account of your objectives, or your financial situation. We aim to bring you long-term focused analysis driven by fundamental data. Note that our analysis may not factor in the latest price-sensitive company announcements or qualitative material. Simply Wall St has no position in any stocks mentioned.
Have feedback on this article? Concerned about the content? Get in touch with us directly. Alternatively, email editorial-team@simplywallst.com
① During the campaign period, US stocks, US stocks short selling, US stock options, Hong Kong stocks, and A-shares trading will maintain at $0 commission, and no subscription/redemption fees for mutual fund transactions. $0 fee offer has a time limit, until further notice. For more information, please visit: https://www.webull.hk/pricing
Webull Securities Limited is licensed with the Securities and Futures Commission of Hong Kong (CE No. BNG700) for carrying out Type 1 License for Dealing in Securities, Type 2 License for Dealing in Futures Contracts and Type 4 License for Advising on Securities.

English